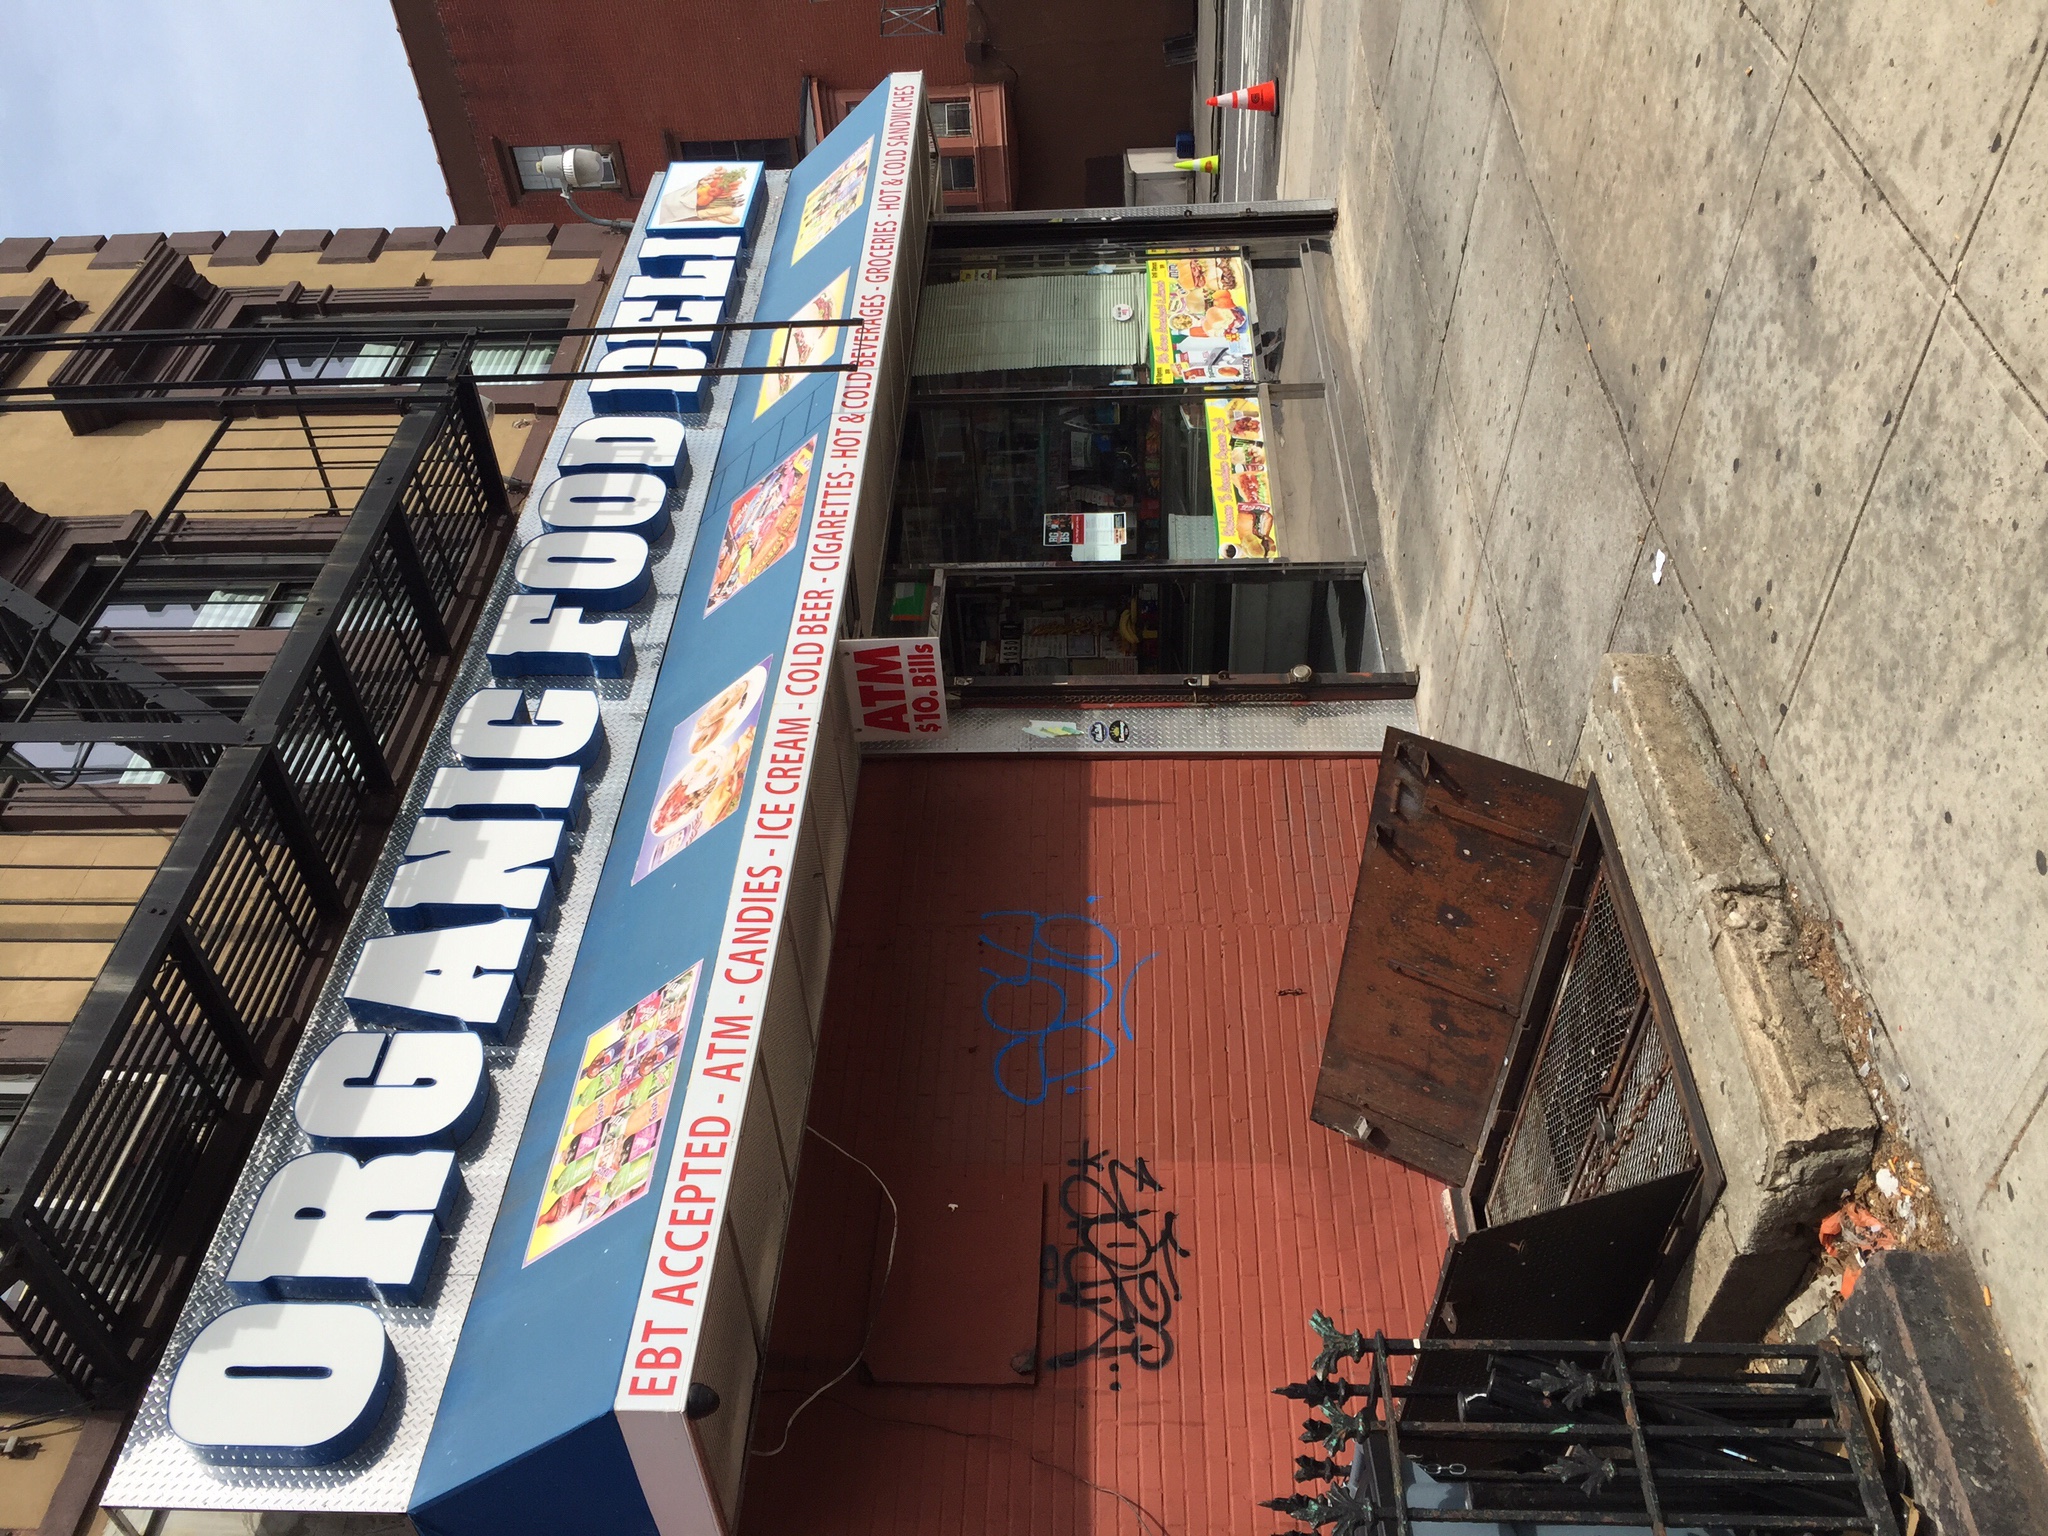
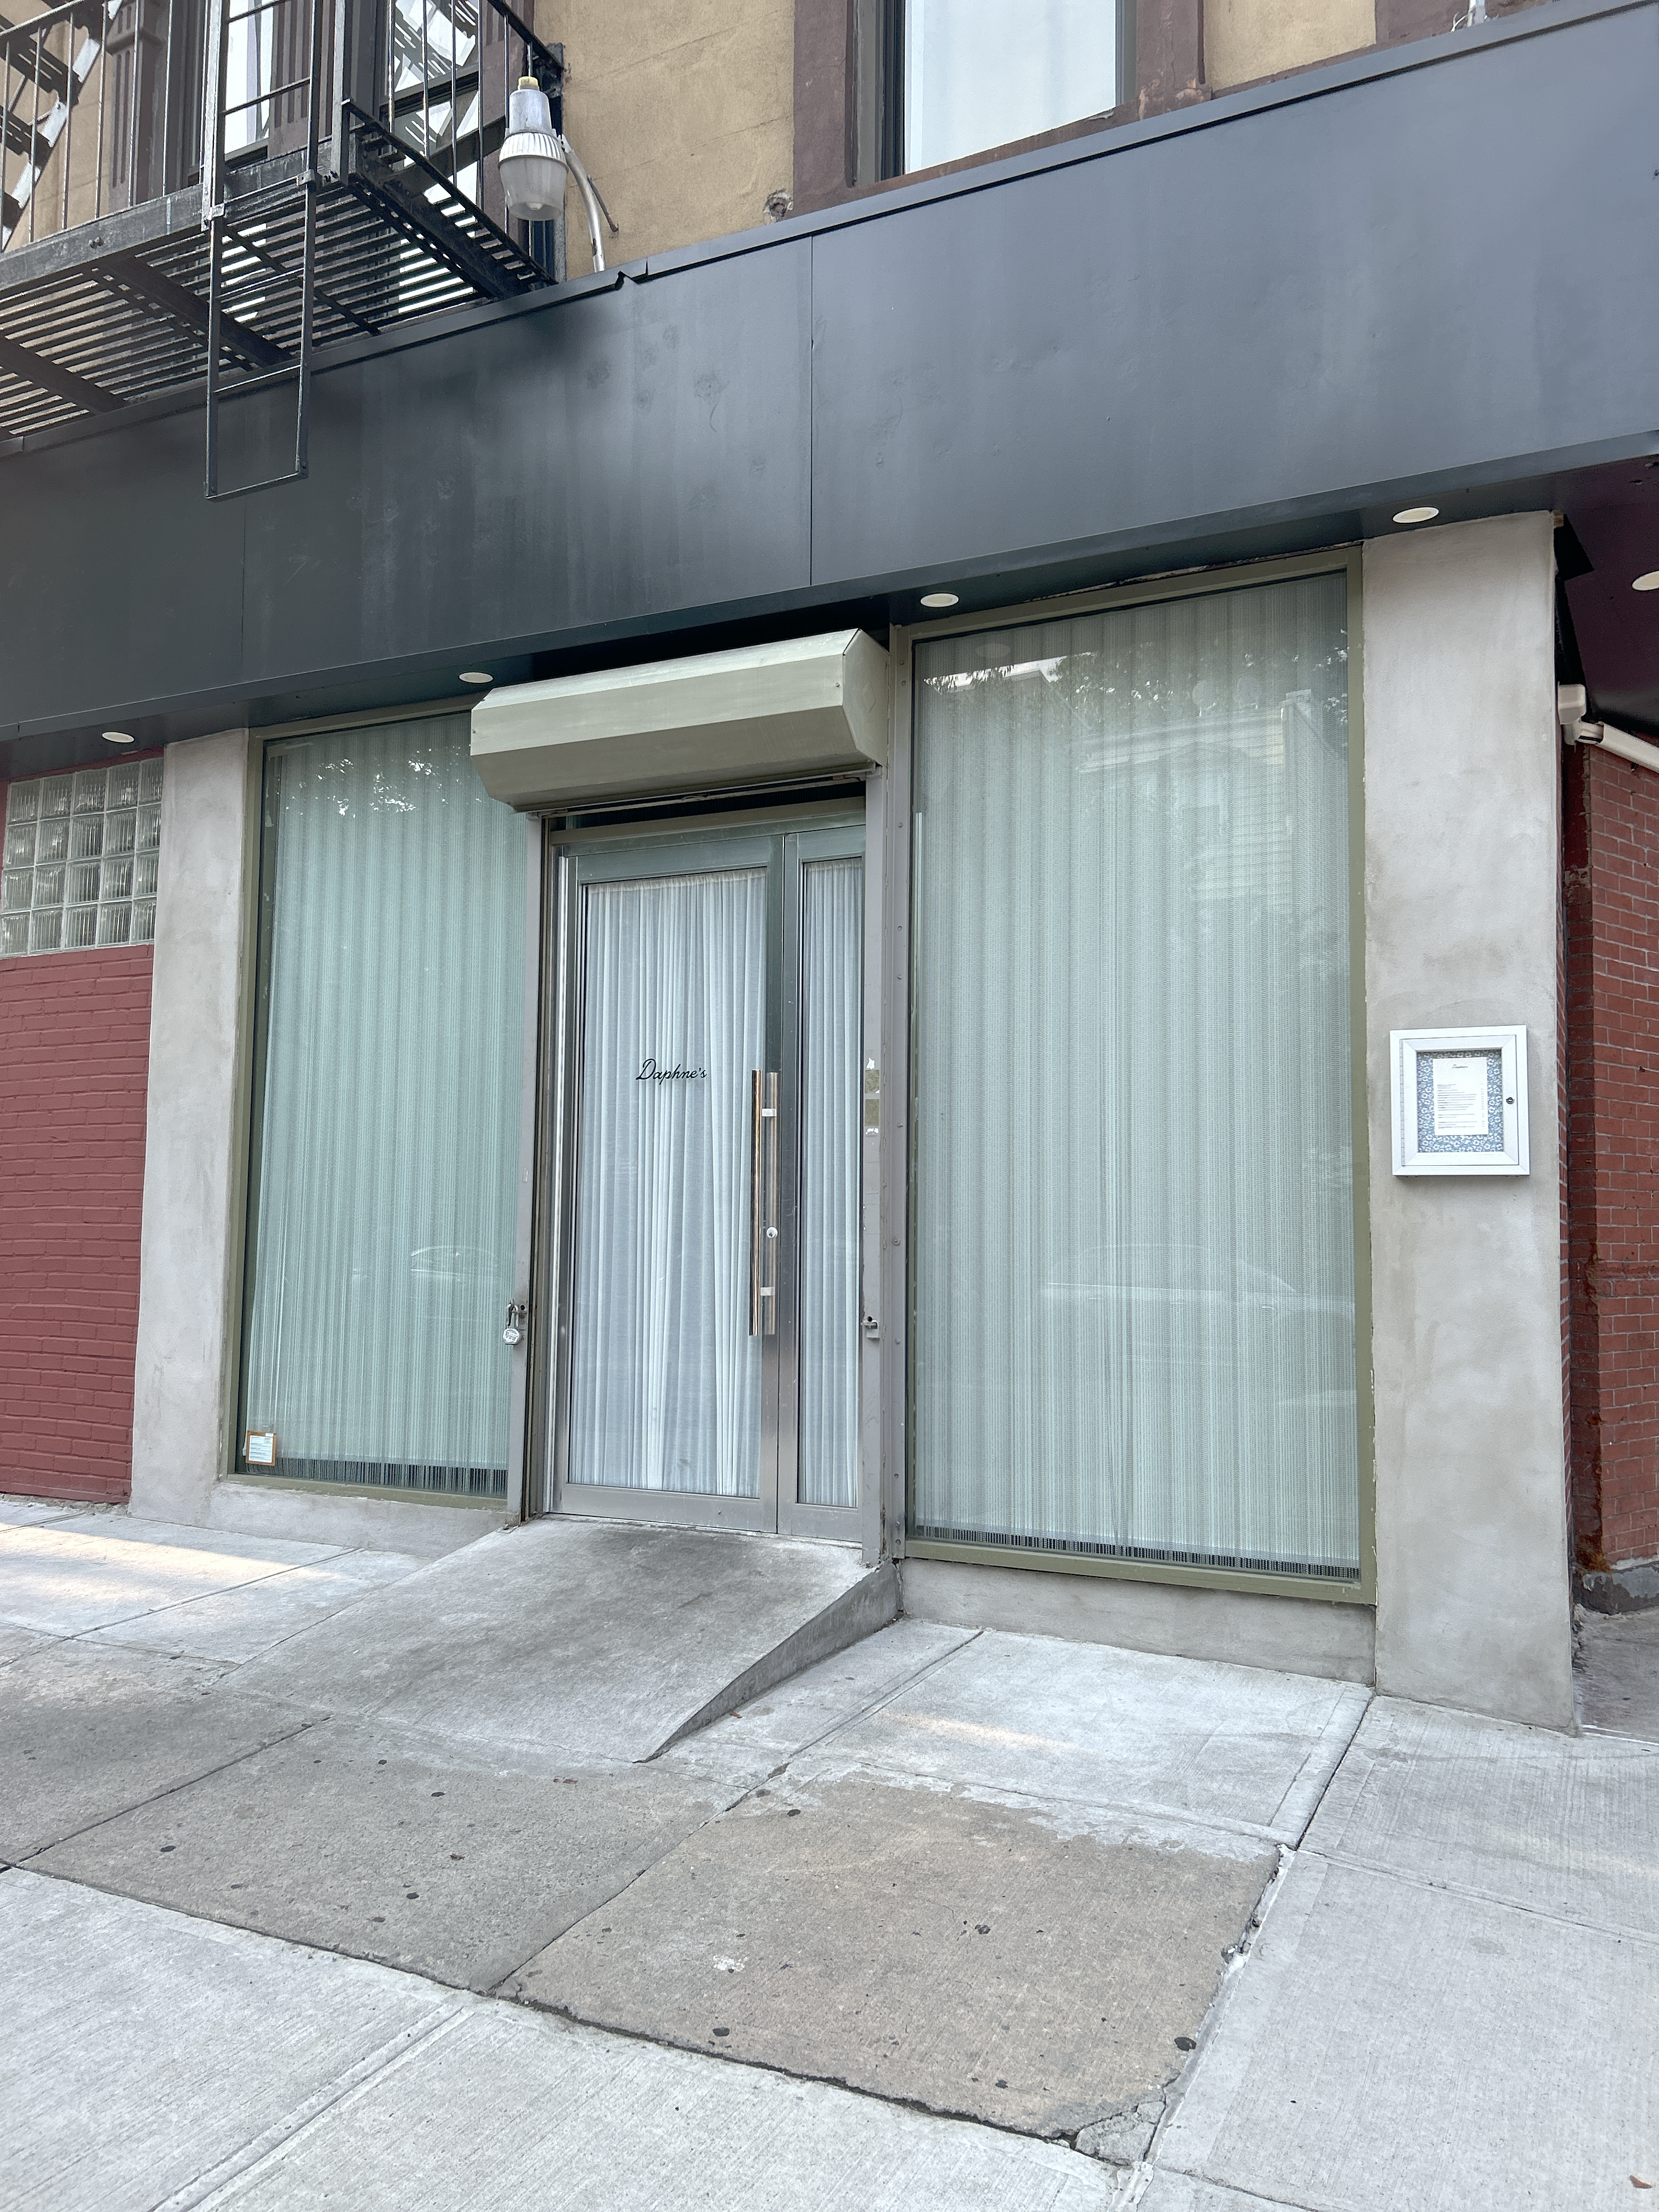
Can you tell the difference between these two storefronts?
They both sell food, and they actually occupy the same physical space--299 Halsey Street in Brooklyn--but across different times. Organic Food Deli is visible on Google Streetview as far back as September 2013, but closed in early 2018. Then a business called Healthy Choice Market occupied the space for a few years. Daphne's, which offers a delicata squash tempura appetizer and a "thoughtfully curated selection of natural wines," opened in summer 2024. It's just one example of the hundreds of retail turnovers the city sees every year.
But they're different for another reason as well. In their book What the Signs Say: Language, Gentrification, and Place-Making in Brooklyn, sociolinguist Shonna Trinch and cultural anthropologist Edward Snajdr identify two strands of storefront presentation in Brooklyn: old-school and new-school.1
The old-school style makes heavy use of text and color to grab the attention of passersby and clearly describe what's on offer inside. The researchers found this has the effect of making it feel welcoming and accessible. The new-school however, relies on symbols and design more than text, and they likely reach their customers online. This has the effect of perplexing onlookers, and making them feel unwelcome or unable to afford what's inside.
Here are some snippets Snajdr and Trinch gathered from actual people speaking in reaction to each style:
"make everyone feel welcome...straightforward...open to everyone"
"what you see is what you get"
"lawless"
"directness... does not discriminate"
"aggressively democratic and tolerant system of commerce"
"collective sincerity...inclusion and openness...democracy in diversity"
"poor, shady, ethnic, outer-borough"
"authentic, quaint, interesting"
"generative inclusivity"
"chaotic, messy...cheap"
"use[s] language literally and explicitly"
"very sparse...cryptic"
"modern"
"expertise...elegant...sophisticated"
"mystery/aspiration/clubbiness"
"clean...uncluttered"
"demure"
"erudite and playful"
"global sophistication"
"like a secret club"
"in-your-face performance of...wealth"
"sophistication, affluence...uniform...flat and characterless"
"erudite, incomprehensible, unwelcoming"
"othering"
I suspected that an image-recognition AI would be able to tell the difference between these two typologies, and I wanted to see if there was a notable change from the old to the new styles over time in a gentrifying neighborhood like Bedford-Stuyvesant. Using Google's free, open-source Teachable Machine, I trained a model on images of storefronts I found around Brooklyn, based on my own understanding of the old/new-school binary. I then turned the model onto nearly 3,000 images of stores that had permanently closed or newly opened in Bed-Stuy over the last 10-ish years, courtesy of a storefront database called LiveXYZ. Here are the results!
These are the results of the image recognition model on the 2,800 Bed-Stuy storefront photos we fed it. Old-school on the left, new-school on the right, with highest confidence of each at the top, lower confidence as you scroll down. You can hover over a thumbnail to see a bigger preview of the storefront and its name and category. How do you think it did?
Here you can see all 2,800 storefront photos plotted within Brooklyn's Community District 3. In the bigger circles, you can see spaces that saw one older business replaced by a newer one, sometimes multiple times in the last few years. Click a dot for a pop-up of the business names and photos. For a deeper dive into same-space turnover, check out the "More findings & Methodology" tab. Can you spot any trends across the neighborhood's geography?
Marker Size:
Pie Chart:
Here you can see the neighborhood's openings and closings across time. Since the LiveXYZ storefront data is collected by hand, there will typically be a lag between when a business opens/closes and when it's registered, which is why you'll see lots of closings/openings logged on the same day. Can you identify any trends?
Statistical Analysis
Here are some of the headline findings on the relationship between closed and new businesses in Bed-Stuy, and the old- or new-school class predicted by the model. For full analysis and methodology, click the PDF at the bottom of this page.
This stacked area chart shows the shifting balance of stores in Bed-Stuy, as businesses in the new-school style slowly replace those in the old-school. However, remember these data only include newly opened stores and ones that failed over the observed time period, not stores that existed before record-keeping began and have managed to stay open. There are about 1,000 of those that I left out of the analysis in the sake of time.
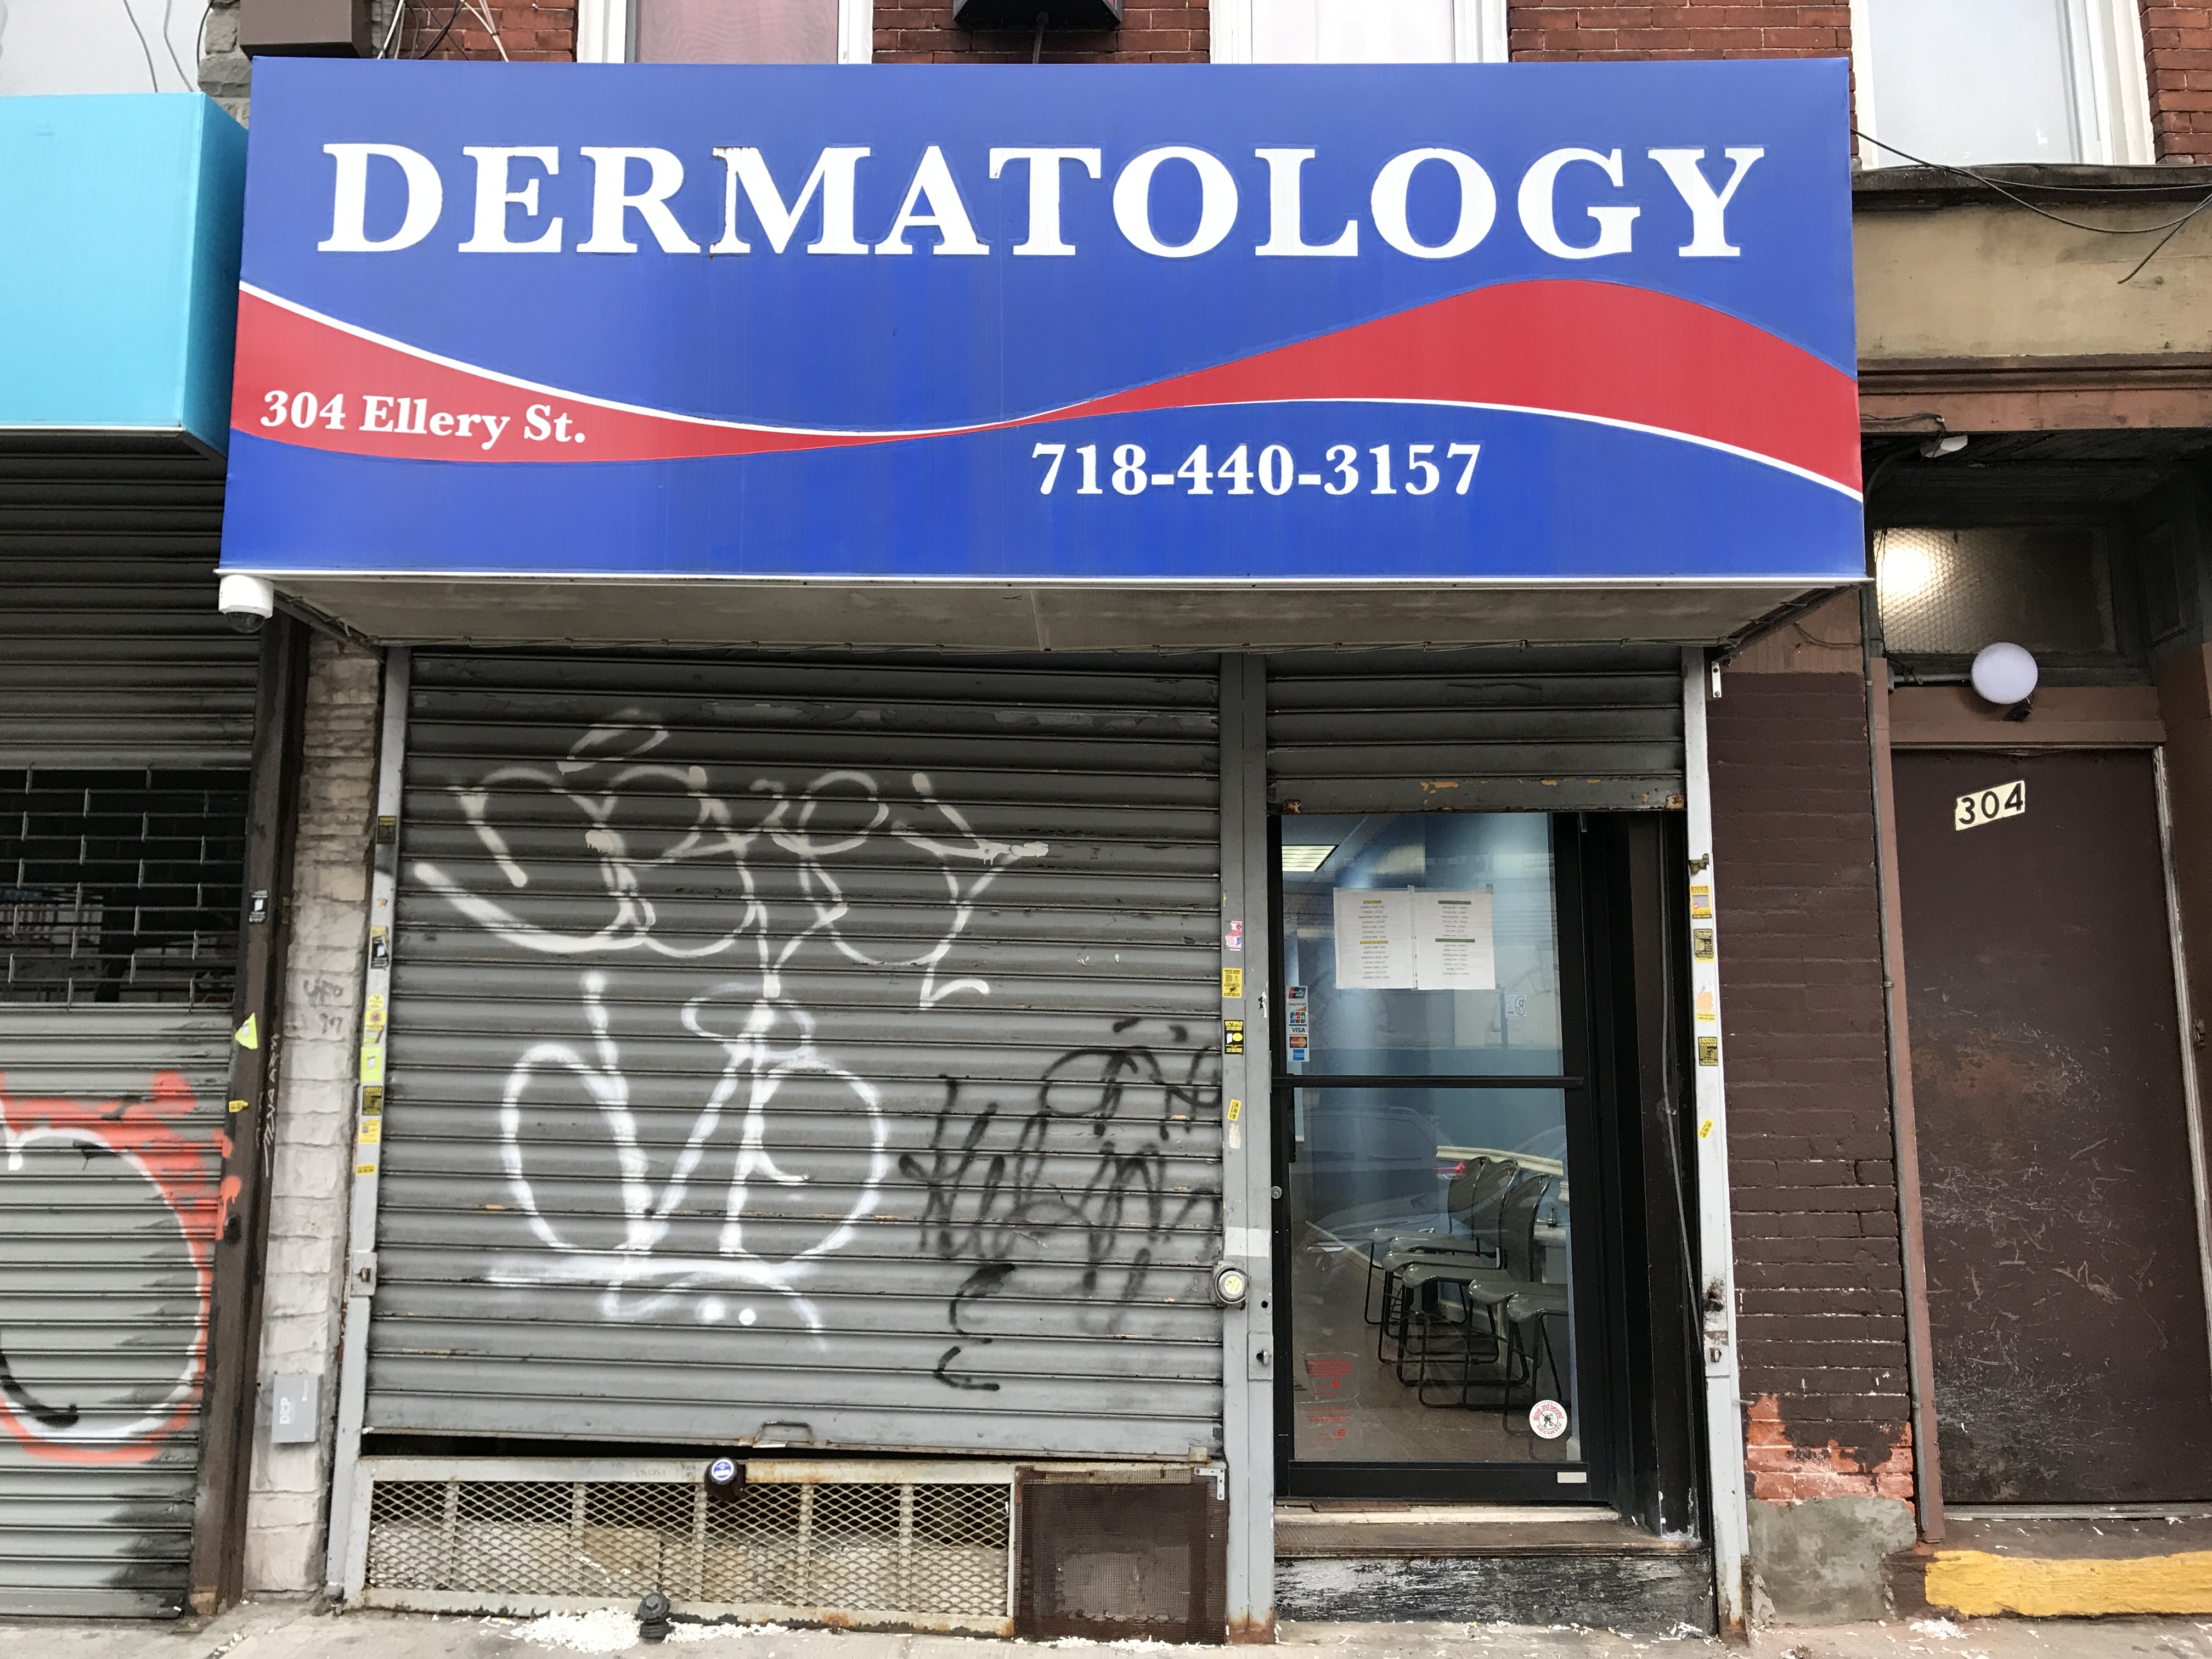
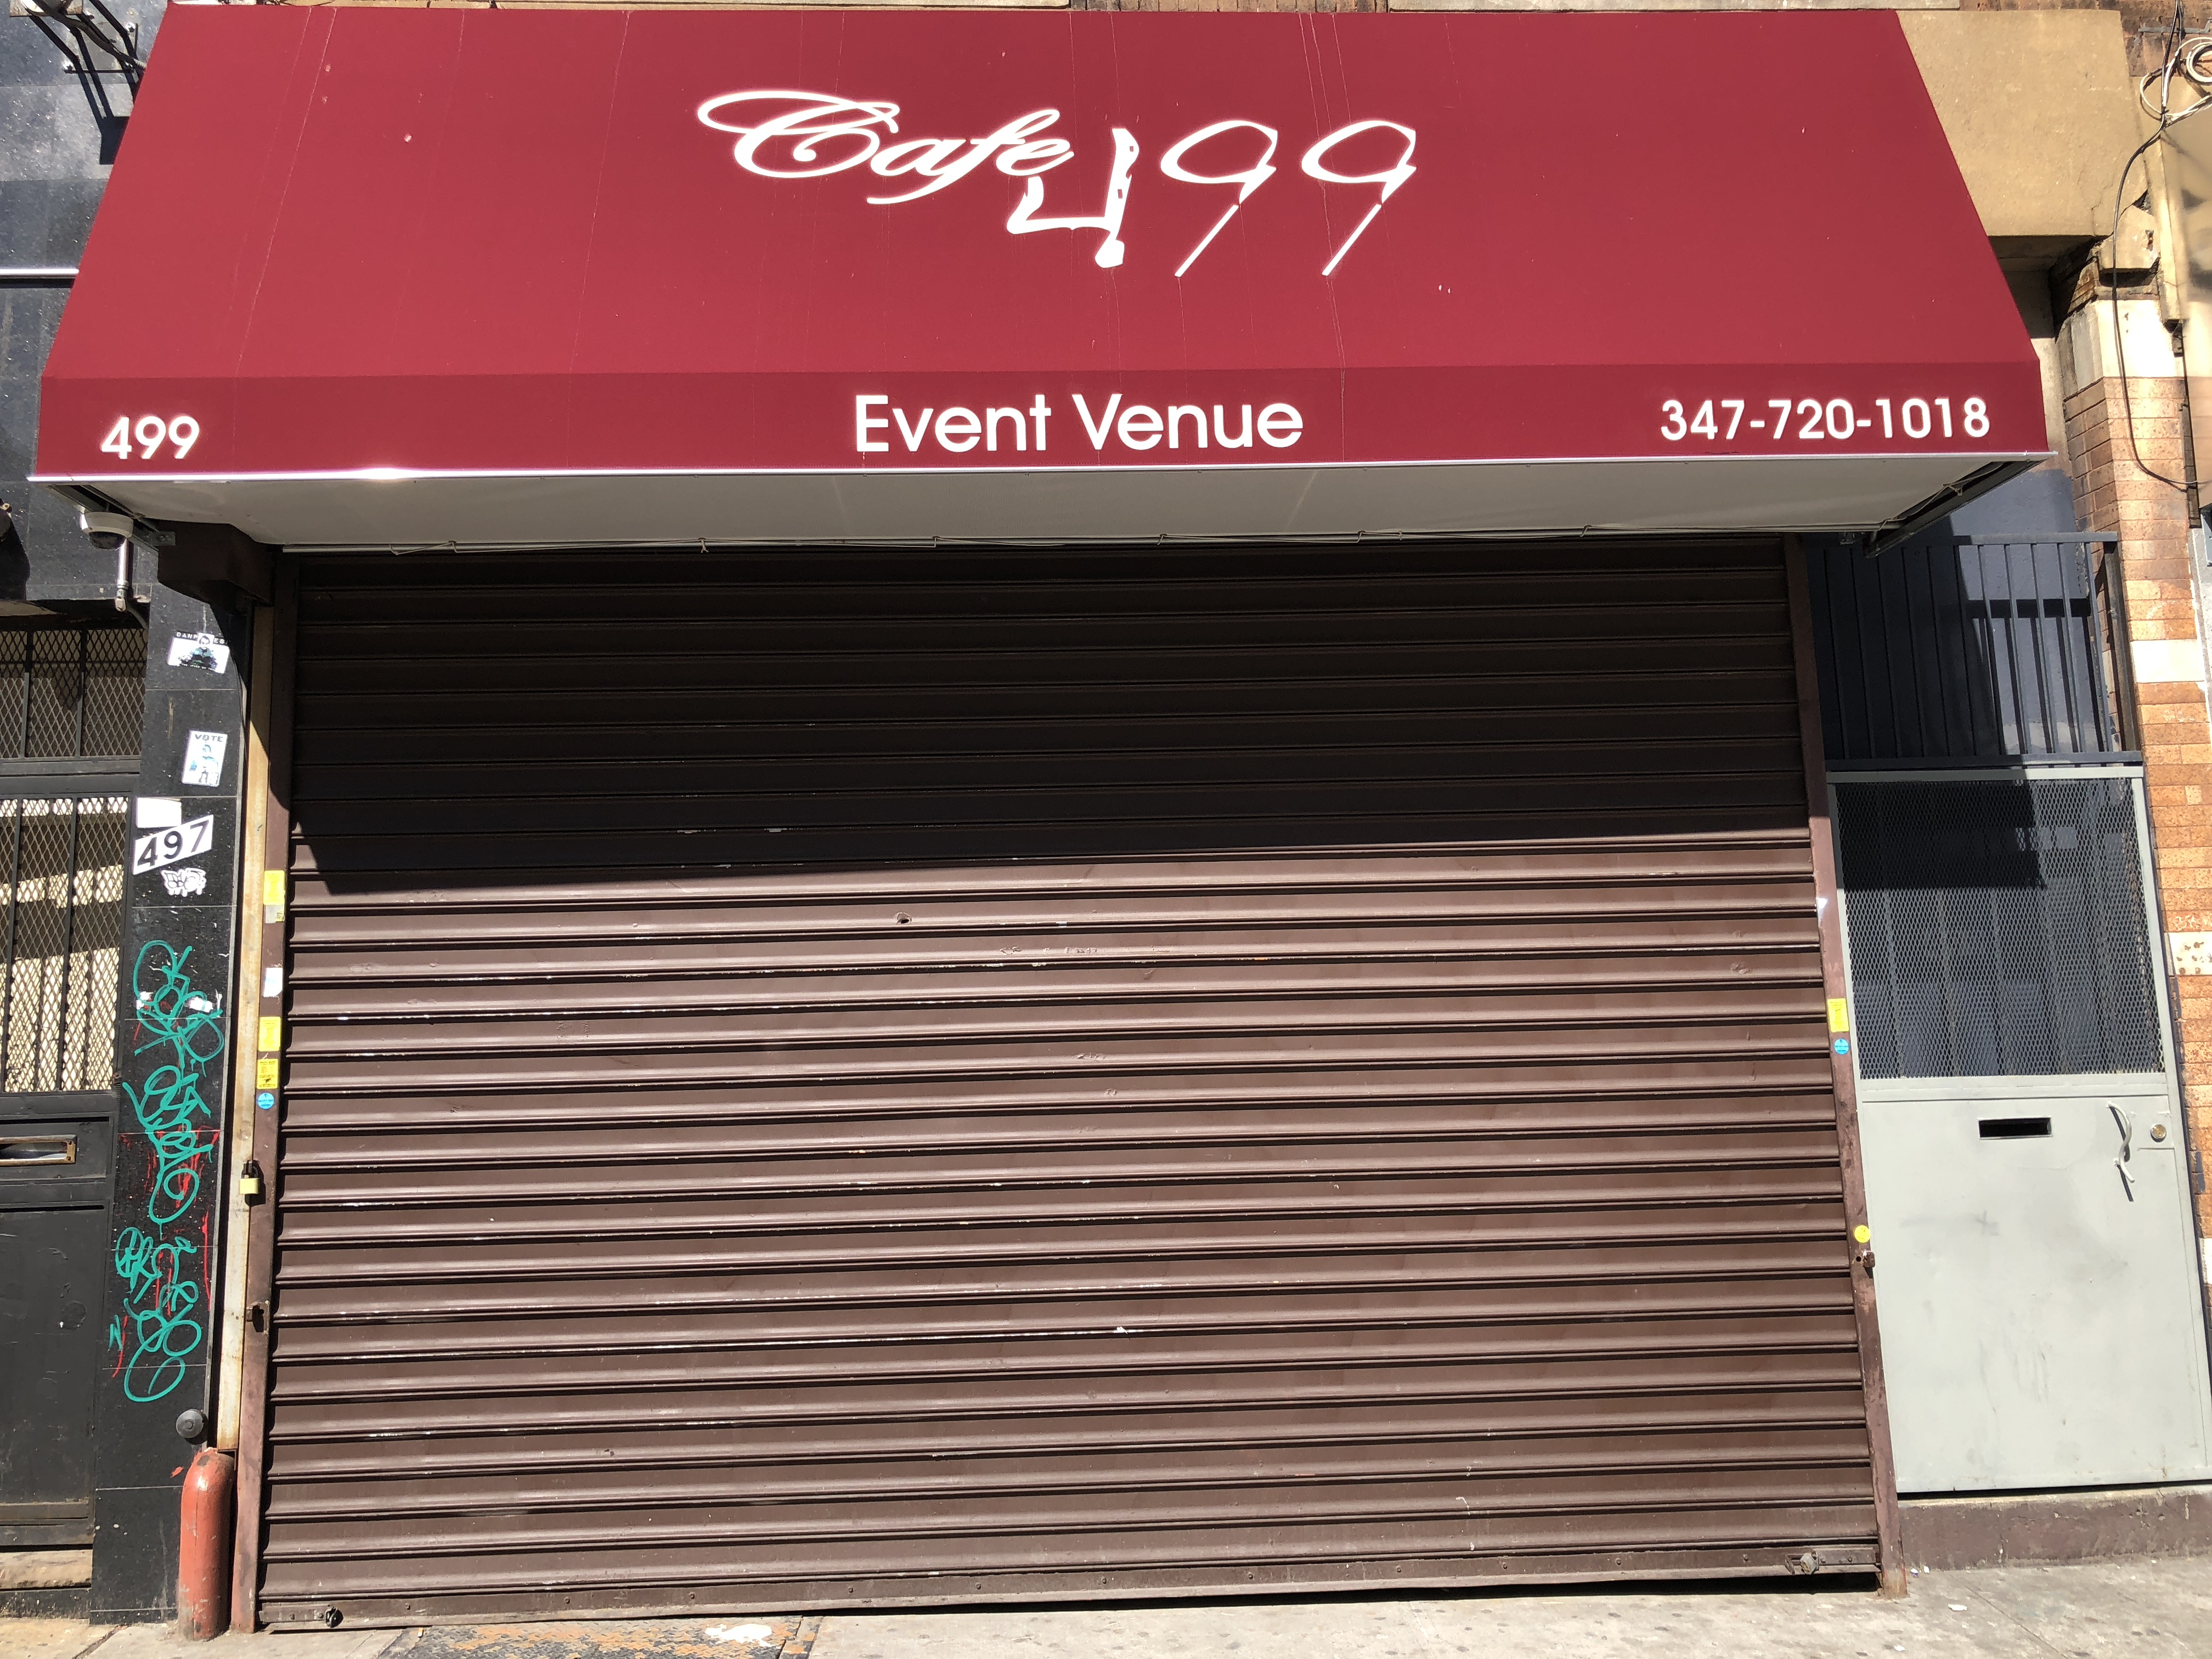
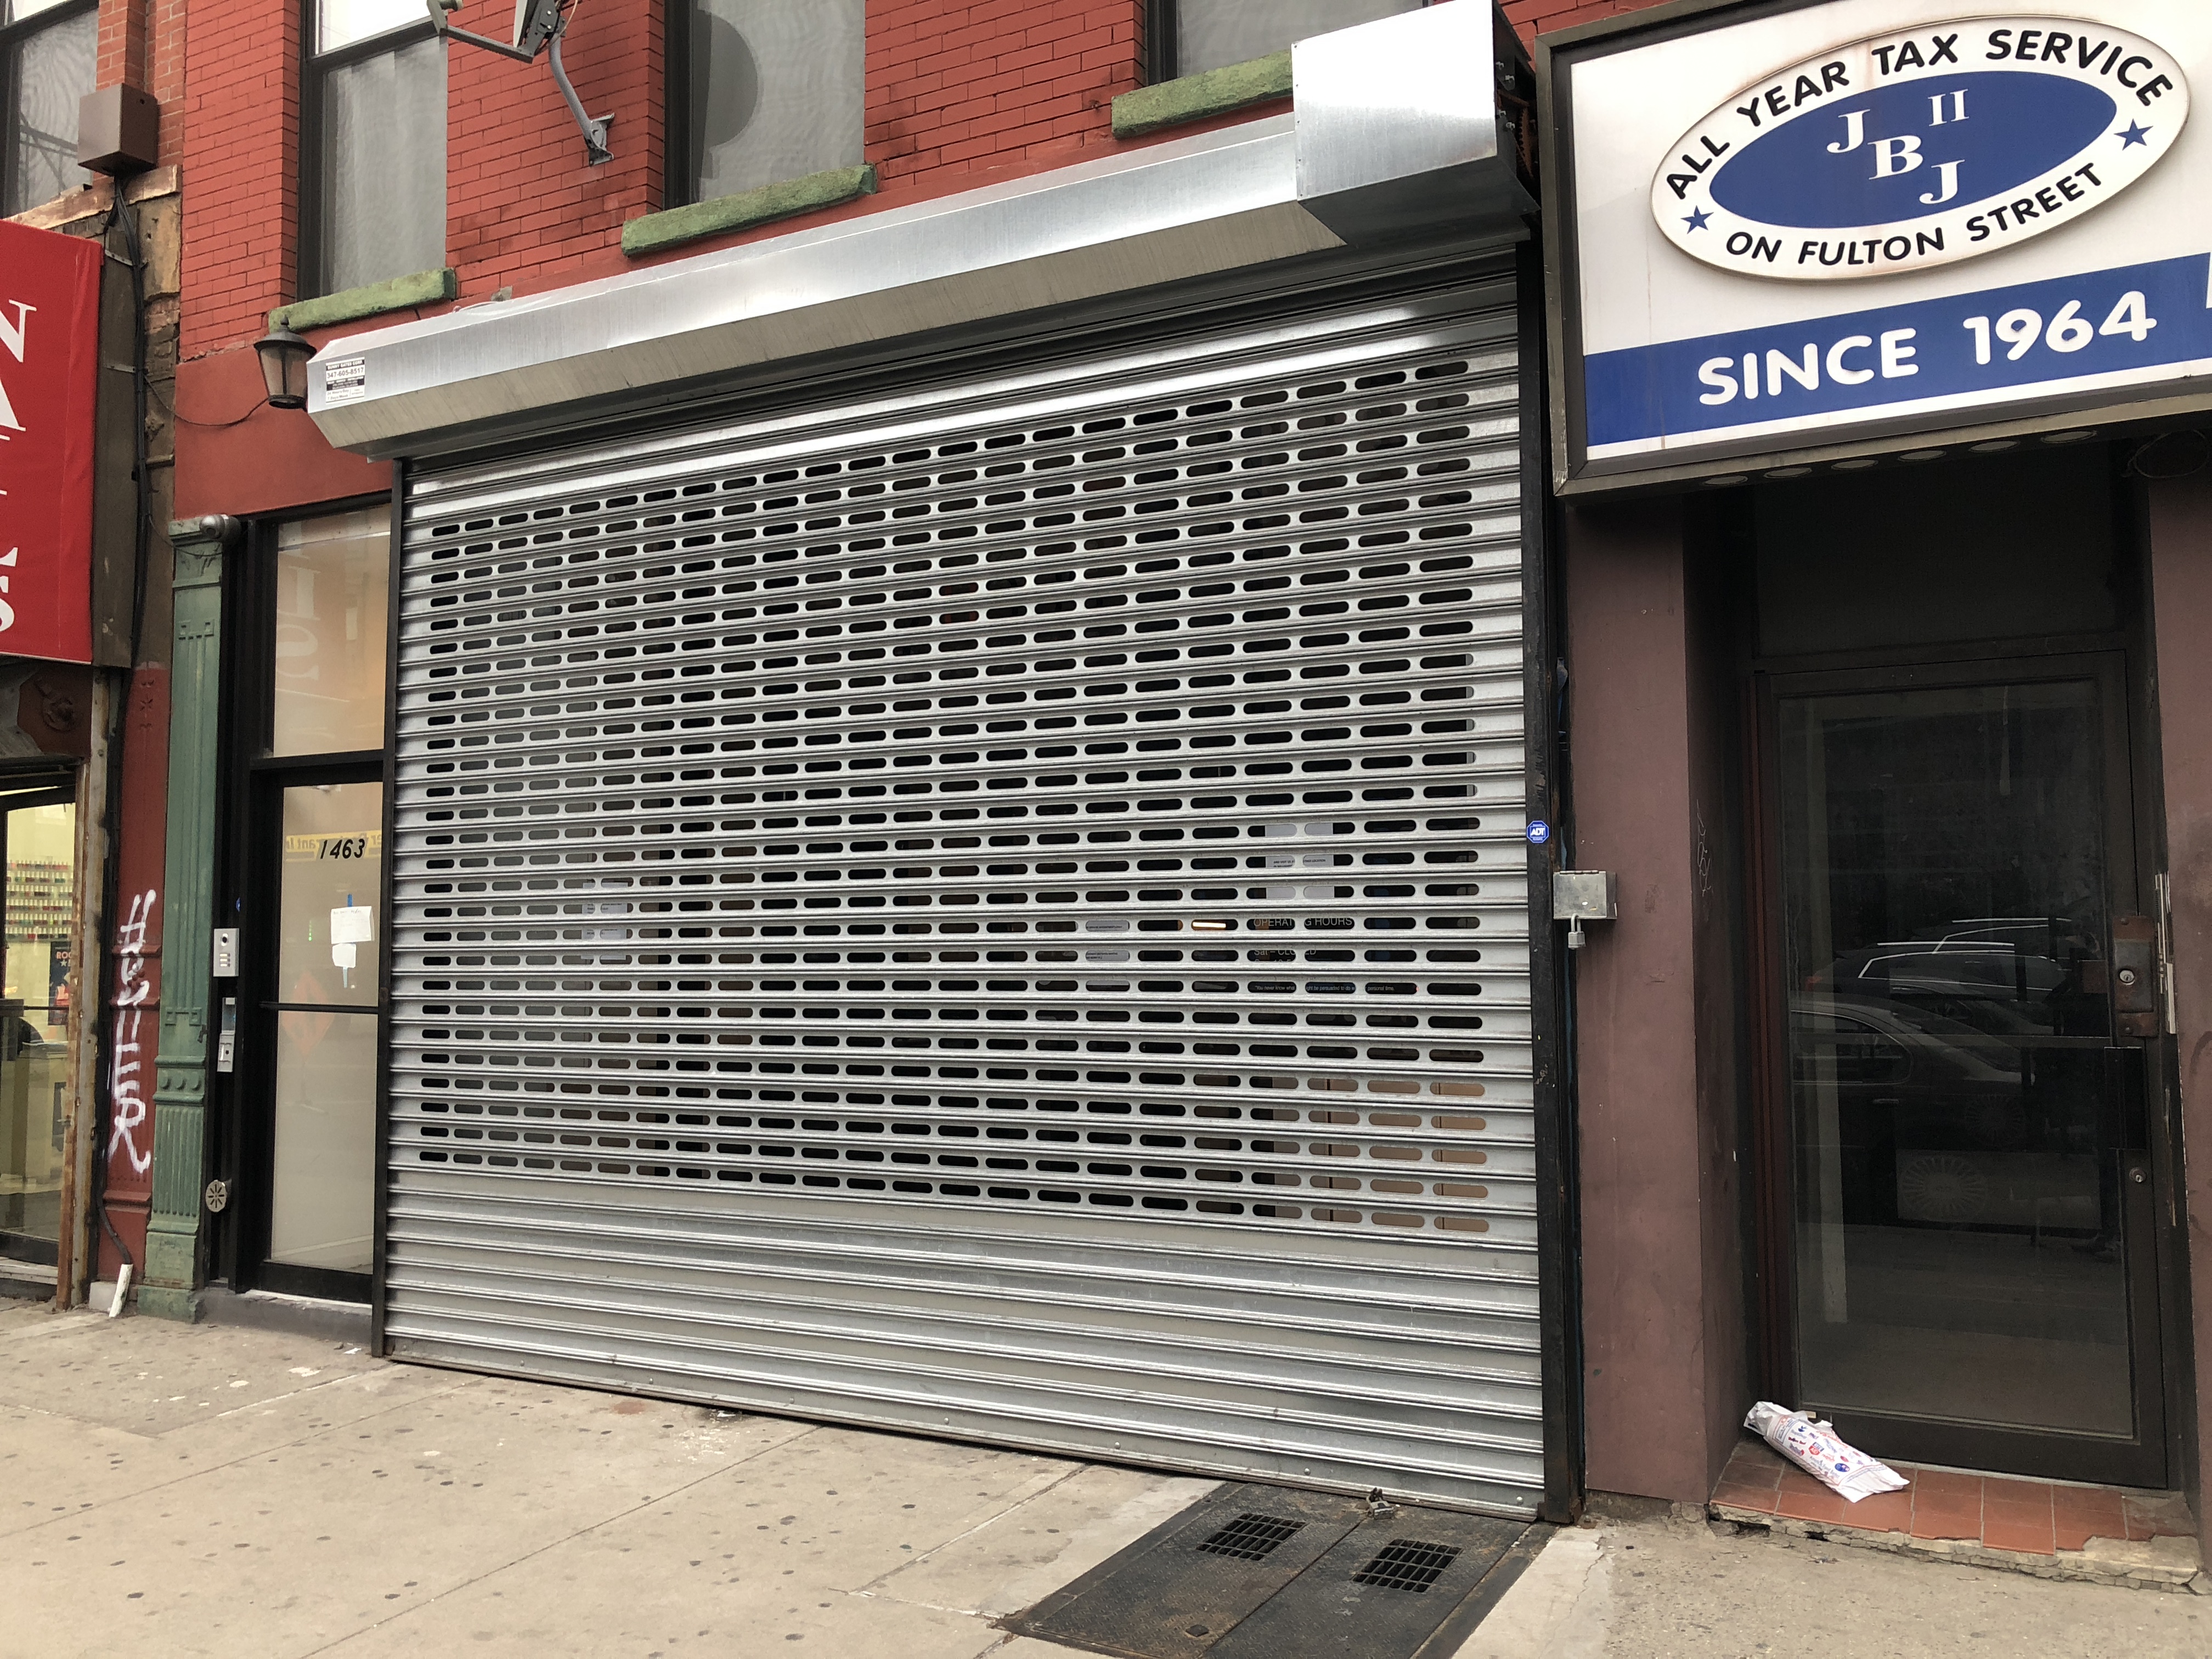
Security gates
Have you seen storefronts in your neighborhood that look like this? These heavy, opaque security gates are technically going to be illegal in New York City starting in 2026.2 The Department of Small Business Services thinks they make the streetscape look foreboding. But for the purposes of this project, they really obscure the unique storefront design details underneath. I tried to train the model on them as a third category, but it seemed to confuse the model, and it started making wonky predictions about the old- and new-school looks! So I took them out. But there are about 200 photos like this in the dataset (~7% of the total).
Turnover
As you might have noticed on the map or on the intro page, lots of the new stores we're talking about replaced closed businesses in the exact same location. This was actually the case with the majority of the stores we analyzed. There are only about 1,600 unique storefront locations in the dataset, so about 1 for every 2 businesses on average. In the "churn-iest" cases, 6 addresses saw 5 different businessses rotate through over the roughly 8 years observed!
Location Reuse Statistics
Among the 2,809 storefronts with photographic documentation:
- Unique locations: 1,632 coordinate pairs
- Locations with multiple businesses: 915 (56% of unique locations)
- Total businesses sharing locations: 2,092 (74% of businesses with images)
- Maximum businesses at a single location: 5
- Average businesses per shared location: 2.29
- Median businesses per shared location: 2
Turnover Flow
This diagram shows the changing business names and styles for the ~2,000 business that shared an address with at least one other business over the observed time period. While some switched from old-school to new-school or vice versa, a significant majority stayed in the same class. Do you think this says something about the buildings or micro-neighborhoods these businesses are located in?
Legend
Click here to see the storefront data the model was trained on
Works Cited
- Trinch, S., & Snajdr, E. (2020). What the Signs Say: Language, Gentrification, and Place-Making in Brooklyn. Vanderbilt University Press. https://doi.org/10.2307/j.ctv160btqs
- New York City Small Business Services. 2012. Storefront Improvements: A Guide for Commercial Districts. New York City: City of New York. https://www.nyc.gov/html/sbs/downloads/pdf/neighborhood_development/storefront-guide.pdf (downloaded via Wayback Machine: https://web.archive.org/web/20210829205448/http://www.nyc.gov/html/sbs/downloads/pdf/neighborhood_development/storefront-guide.pdf)